

marmot prof
Read a CPU or memory profile in the terminal.
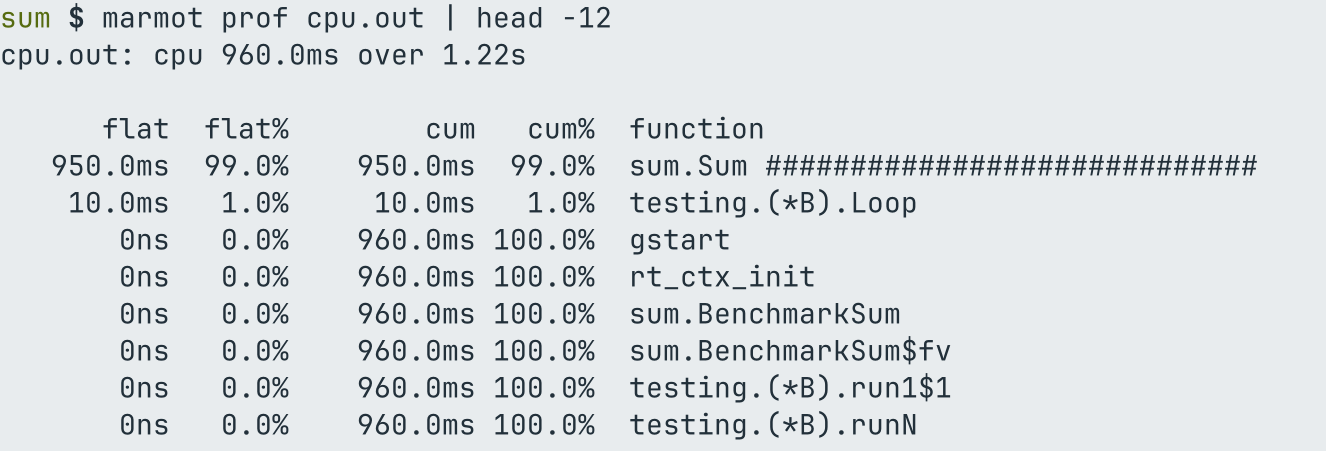
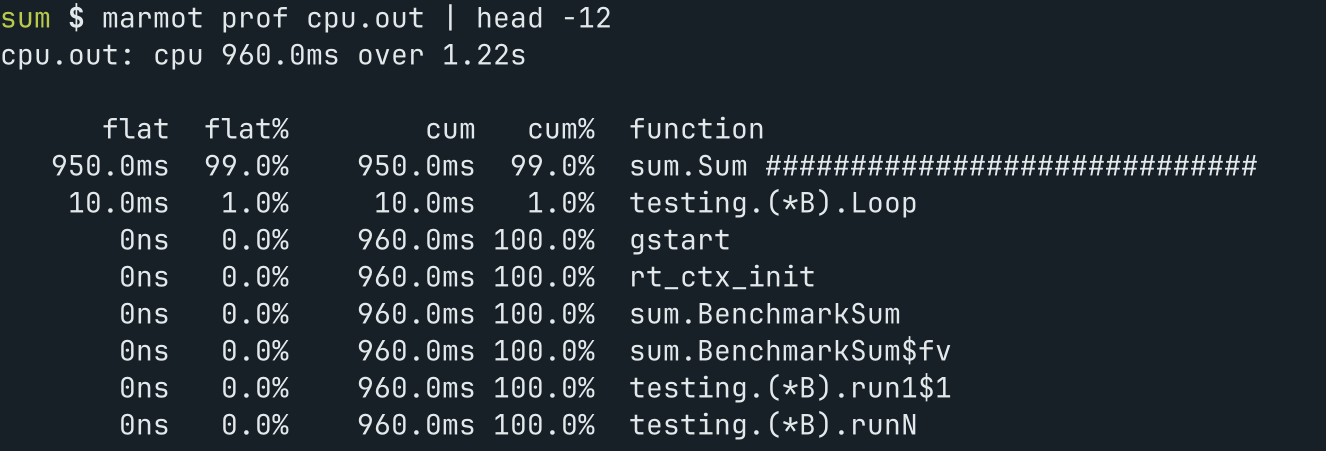
Show a pprof profile (from marmot bench -cpuprofile, go test -cpuprofile, or runtime/pprof): the top functions by cost, the hottest path, the call tree as a text flame graph (-tree), or the source of functions with the cost of each line (-list). -json gives agents the same data.
marmot prof PROFILE [flags]Examples
marmot prof cpu.out
marmot prof -tree cpu.out
marmot prof -list 'parse.*' cpu.out
marmot prof -sample alloc_space mem.out
marmot prof reads any pprof CPU or memory profile: the functions with the most cost (flat and
cumulative), the hottest path, -tree for the call tree as a text flame graph, -list REGEXP
for the source of matching functions with the cost of each line, -sample alloc_space and
friends for memory profiles, and -json for programs.
Programs built by marmot record CPU profiles with the standard runtime/pprof API
(pprof.StartCPUProfile), so the same profile can be read with marmot prof or go tool pprof. On Linux each thread is sampled on its own CPU clock; on macOS the process timer is
used.
Flags
Flags take one dash or two: -release and --release are the same.
| Flag | Meaning |
|---|---|
-color string | color in human output: auto, always or never (NO_COLOR turns auto off) (default "auto") |
-json | machine readable output: JSON Lines on stderr (also $MARMOT_OUTPUT=json, and the default under coding agents) |
-list string | show the source of functions matching this regexp, each line with its cost |
-min string | leave out tree nodes below this percentage of the total (default "1") |
-n string | how many functions to list (default "15") |
-sample string | sample type to show: cpu, samples, alloc_space, alloc_objects, inuse_space, ... (default: the profile's default) |
-tree | show the call tree (callers above callees) instead of the top list |
Full help
Show a pprof profile (from marmot bench -cpuprofile, go test -cpuprofile, or runtime/pprof): the top functions by cost, the hottest path, the call tree as a text flame graph (-tree), or the source of functions with the cost of each line (-list). -json gives agents the same data.

Usage:
  marmot prof PROFILE [flags]

Examples:
marmot prof cpu.out
marmot prof -tree cpu.out
marmot prof -list 'parse.*' cpu.out
marmot prof -sample alloc_space mem.out

Flags:
      --color string    color in human output: auto, always or never (NO_COLOR turns auto off) (default "auto")
  -h, --help            help for prof
      --json            machine readable output: JSON Lines on stderr (also $MARMOT_OUTPUT=json, and the default under coding agents)
      --list string     show the source of functions matching this regexp, each line with its cost
      --min string      leave out tree nodes below this percentage of the total (default "1")
      --n string        how many functions to list (default "15")
      --sample string   sample type to show: cpu, samples, alloc_space, alloc_objects, inuse_space, ... (default: the profile's default)
      --tree            show the call tree (callers above callees) instead of the top list